Projects
AtmoSeer
AtmoSeer originates from the objective of applying advanced deep learning techniques to the complex domain of atmospheric science, specifically for forecasting greenhouse gas concentrations. This project is a full-stack data science project, using advanced techniques in data engineering, data analysis, and deep learning to gather raw greenhouse data from NOAA, train a bidirectional recursive neural network on it, and then deploy it to a fully interactable front-end website that allows users to visually see the projection of global greenhouse gases. The aim is to provide a robust tool for understanding the past, and anticipating future changes in 4 of the most potent atmospheric gases like Carbon Dioxide (CO2), Methane (CH4), Nitrous Oxide (N2O), and Sulfur Hexafluoride (SF6). By making advanced data modeling accessible, AtmoSeer attempts to offer valuable insights for environmental monitoring and research, as there are plenty of tools and sources for looking at past atmospheric gas data, but limited on open-sourced time series models.
This pipeline begins with the acquisition of foundational data, also known as the “Extract” phase in the data engineering pipeline. Atmospheric measurements for the four principal greenhouse gases are sourced from the National Oceanic and Atmospheric Administration's Global Monitoring Laboratory (NOAA GML), a standard for high-quality atmospheric data gathered around the globe and given freely to the public. To provide ecological context, biomass data is integrated from NASA's Moderate Resolution Imaging Spectroradiometer (MODIS) and integrated during the feature engineering phase.
The first phase of the pipeline is the ETL phase, where the raw data extracted from the source, transformed into a usable format, and loaded into an organized data warehouse to analyze and use for training. These transformations include data cleansing (addressing anomalies, interpolating or removing missing values based on domain knowledge), normalization (scaling diverse measurements to comparable ranges to prevent numerical dominance by certain features), and structural reformatting. The refined data is then loaded into a dual-database system: a local PostgreSQL instance for agile development and intensive data manipulation, and a parallel data store in AWS, likely leveraging services such as DynamoDB, for persistence and scalable access.
The first phase is the Extract, Transform, Load (ETL) phase. Raw data, once extracted from the NOAA GML and NASA MODIS sources, undergoes a sequence of programmatic transformations to prepare it for analytical and modeling tasks. These transformations include data cleansing operations, such as the identification and handling of anomalous readings, the imputation of missing values using statistical methods or time-series specific techniques, and the removal of erroneous data points. Numerical features are subjected to normalization, scaling them to a common range (e.g., 0 to 1 or standard normal distribution) to ensure that features with larger magnitudes do not disproportionately influence downstream algorithms. The data is also structurally reformatted, which involves reshaping datasets, aligning temporal resolutions, and creating a consistent schema across different sources. Following these transformations, the processed data is loaded into a dual-database architecture: a local PostgreSQL database is utilized for development, iterative analysis, and rapid querying, while a secondary data store is established in AWS for backup, persistence, and potentially scalable production access.
Once the data is cleaned, transformed, and organized temporally, it is ready to be transformed into a format that an AI algorithm can understand. This is commonly referred to as the preprocessing phase. This involves the numerical encoding of any categorical features and a thorough validation of data integrity. A key operation here is the partitioning of data into training and validation subsets. To maintain the temporal integrity of the time series and to evaluate the model's predictive performance on data it has not seen, these splits are temporally ordered: the validation set comprises data points from a period subsequent to that of the training set. This simulates a realistic forecasting scenario and avoids data leakage.
The core predictive engine of AtmoSeer is focused around the deep learning time series analysis model. This is not a monolithic model, but a framework that instantiates four specialized models, one for each target greenhouse gas. This gas-specific modeling allows for the capture of unique temporal dynamics and behaviors that are unique to CO2, CH4, N2O, and SF6.
The AtmoSeer architecture is built using a Bidirectional Long Short-Term Memory (BiLSTM) network. BiLSTMs are a sophisticated variant of Recurrent Neural Networks (RNNs), adept at modeling both long-range dependencies and short-term trends, as there are often complex temporal patterns in sequential data. The "bidirectional" characteristic essentially means that input sequences are processed in both chronological and reverse-chronological order. This dual processing allows the model to incorporate information from both past and (relative) future time steps when constructing its internal representations, often leading to a richer understanding of the sequence context. While BiLSTMs can be computationally demanding, the purpose of this project was to focus on accurately modeling complex atmospheric gas trends, rather than a fast model that is less accurate. This tradeoff is a common concern in machine learning operations, where a heavy and computationally expensive model might be more accurate, but it will take longer to perform calculations. With this taken into account, logic for GPU acceleration was woven into the core architecture of AtmoSeer, which mitigates computational overhead during training and deployment by increasing efficiency by over 100x.
AtmoSeer utilizes an advanced approach to processing environmental data, starting with normalization to make sure there is consistent scaling and stable learning. Like stated before, at its core lies a bidirectional processing system that analyzes sequences from both forward and backward directions simultaneously, capturing contextual atmospheric data from both past and future time points. This bidirectional architecture can include multiple stacked layers with strategic dropout techniques to prevent overfitting. The model's most innovative aspect is its attention mechanism, which functions like a spotlight to focus on the most relevant information while dimming less important signals, which creates a more focused representation of the input data. The architecture uses initialization strategies for different components, orthogonal initialization for recurrent weights to mitigate gradient issues common in such networks, and Xavier/Glorot uniform initialization for other weight matrices to maintain consistent signal strength. This design creates a robust system capable of extracting patterns from complex environmental data while avoiding common training pitfalls.
The model's performance is optimized through Bayesian optimization, a sample-efficient approach for functions that are expensive to evaluate. This process uses a Gaussian Process (GP) surrogate model to approximate the objective function by mapping hyperparameters to performance metrics. The system utilizes acquisition functions such as Expected Improvement (EI) or Upper Confidence Bound (UCB) to determine which hyperparameter configurations to evaluate next. These functions mathematically balance exploration (sampling in high uncertainty regions) and exploitation (sampling in regions predicted to perform well). Each iteration updates the GP model with new hyperparameter-performance pairs, progressively refining the surrogate model's accuracy in predicting optimal configurations for parameters like learning rate, LSTM layer count, hidden dimensions, and dropout rates.
Upon completion of the optimization process, the system identifies optimal hyperparameter configurations for each of the four gas detection models based on quantitative performance metrics. These configurations, including architectural specifications and learned parameters (weights and biases), are systematically archived in dedicated directory structures. The preservation mechanism typically involves PyTorch state dictionary files (.pth or .pt) containing model parameters, alongside JSON files that document the complete optimization trajectory, trial outcomes, and final parameter selections.
The trained models are embedded within a Streamlit web application, structured around a main home page and dedicated sub-pages for individual greenhouse gases. Users can interact with the application in two primary ways: exploring historical gas concentration data by selecting specific dates or timeframes, and generating forecasts for future dates. For forecasting, the application retrieves the appropriate pre-trained AtmoSeer model and processes recent historical data as input. The forecasting mechanism employs an autoregressive approach where each prediction becomes input for subsequent predictions, while Monte Carlo sampling with noise injection provides uncertainty bounds around the central forecast.
The application prioritizes accessibility through an intuitive interface with consistent navigation elements and custom styling across all pages. Each gas-specific page manages its own model interactions, data processing, and visualization components, presenting users with relevant information through Streamlit's interactive widgets. This structure allows users to easily switch between different greenhouse gases while maintaining a consistent experience throughout the application.
The application's deployment uses Streamlit Cloud's infrastructure, which directly connects to this project's GitHub repository to maintain synchronization with the latest codebase. This deployment strategy eliminates the need for manual server configuration or specialized DevOps knowledge, as Streamlit Cloud automatically handles the hosting environment, computational resources, and web serving capabilities required for both the frontend interface and backend model execution. All for free. The platform's integration with GitHub enables continuous deployment, where updates pushed to the repository are automatically reflected in the live application, while also providing essential services like authentication, HTTPS security, and application scaling without requiring additional infrastructure management from a development team.
AtmoSeer was built to act as a bridge using time-series modeling with accessible environmental data visualization and forecasting. By combining advanced deep learning techniques with intuitive user interfaces, this system democratizes access to critical information about atmospheric greenhouse gas concentrations, supporting both scientific understanding and public awareness of environmental trends.
RoBi
RoBi (RoBERTa-BiLSTM) is a hybrid sentiment analysis architecture that combines the contextual understanding capabilities of transformer-based RoBERTa with the sequential processing power of bidirectional Long Short-Term Memory networks. This hybrid architecture addresses a significant limitation in modern natural language processing: the inability of transformer models to effectively process texts longer than their maximum sequence length. Through a sliding window approach and Bayesian optimization techniques, RoBi enables sentiment classification on texts of arbitrary length while maintaining computational efficiency.
Pipeline Architecture Overview
The RoBi pipeline consists of five stages: data acquisition and preprocessing, corpus normalization and cleaning, sentiment labeling and data warehousing, model training with hyperparameter optimization, and model deployment. Each stage is designed to ensure data integrity, computational efficiency, and model performance. The pipeline processes raw text corpora from diverse sources and produces a production-ready sentiment analysis model capable of processing texts of arbitrary length.
Data Preprocessing and Normalization Pipeline
RoBi's preprocessing pipeline is implemented through the TextNormalizer class, which performs text normalization operations essential for consistent sentiment analysis results. The normalization process begins with HTML tag stripping using BeautifulSoup, removing standard HTML elements and embedded JavaScript and CSS content that could introduce noise into the sentiment analysis process.
The preprocessing pipeline incorporates several normalization steps. URL and email removal ensures that web addresses and contact information don't influence sentiment predictions. Accented character normalization transforms Unicode characters into their ASCII equivalents, reducing vocabulary variation caused by different character encodings. Contraction expansion utilizes a mapping dictionary to convert informal contractions like "won't" and "can't" into their full forms, providing the model with consistent linguistic patterns.
Special character removal and repeated character reduction enhance text quality. The system handles character repetition by utilizing WordNet to verify word validity, ensuring that meaningful words aren't incorrectly shortened while normalizing emphatic expressions like "sooooo good" to "so good". The lemmatization process converts words to their dictionary forms using spaCy's NLP model, providing semantic consistency while preserving grammatical integrity through pronoun handling.
SQLite Data Warehousing Strategy
RoBi implements a data warehousing solution using SQLite for storage and retrieval of processed text corpora and their corresponding sentiment labels. The database schema is optimized for storage efficiency and query performance, featuring indexed tables for data access during training and validation phases. The warehousing system maintains data integrity through foreign key constraints and implements transaction-based operations to ensure consistency during concurrent access.
The data warehouse stores preprocessed text alongside metadata including source information, processing timestamps, and quality metrics. This approach enables reproducible research by maintaining an audit trail of data transformations. The system implements data versioning capabilities, allowing researchers to track changes in preprocessing methodologies and their impact on model performance over time.
Sliding Window Architecture
RoBi's sliding window approach addresses the constraint of transformer models being limited to processing sequences of 512 tokens maximum. Traditional transformer architectures, including RoBERTa, face challenges when analyzing lengthy documents such as product reviews, academic papers, or social media posts that exceed this threshold.
RoBi's sliding window implementation creates overlapping chunks of text with a configurable stride length, typically set to 256 tokens. This creates 50% overlap between consecutive windows, ensuring that contextual information spanning chunk boundaries is preserved. For example, a 1000-token document would be processed as three overlapping chunks: tokens 0-512, tokens 256-768, and tokens 512-1000 (with padding). Each chunk retains the original document's sentiment label, allowing the BiLSTM component to learn sequential dependencies between chunks belonging to the same text.
The sliding window mechanism operates through several components. The SlidingWindow dataset class handles tokenization using the RoBERTa tokenizer with return_overflowing_tokens=True, which enables the capture of all tokens rather than truncating at the maximum length. The system tracks chunk positions and article IDs, ensuring proper reassembly during inference. Attention masks distinguish between real tokens and padding, allowing the model to focus computational resources on meaningful content while ignoring padded regions.
Hybrid Neural Architecture Design
RoBi's neural architecture combines transformer and recurrent neural network components. The model begins with RoBERTa's pre-trained transformer layers, which provide contextual embeddings through self-attention mechanisms. These embeddings capture semantic relationships and dependencies within each text chunk. The transformer output is then fed into a bidirectional LSTM layer, which processes the representations in both forward and backward directions.
The bidirectional LSTM component processes narrative flow and temporal dependencies that span across chunk boundaries. This dual-directional processing allows the model to understand how earlier and later parts of a text influence each other's sentiment. For instance, phrases like "I thought it would be great, but..." require understanding of both the initial positive expectation and subsequent negative evaluation to correctly classify the overall sentiment.
An attention mechanism is integrated between the BiLSTM and classification layers, learning to weight the importance of different text segments for sentiment prediction. This attention component helps the model focus on sentiment-relevant phrases while maintaining awareness of the broader context. The final classification layer combines contextual meaning from RoBERTa, sequential patterns from BiLSTM, and attention-weighted importance scores to produce sentiment predictions.
Training Methodology
RoBi's training process implements several techniques to achieve performance while preventing overfitting. The training pipeline utilizes a one-cycle learning rate policy, which initially increases the learning rate to help escape local minima, then gradually decreases it for convergence. This approach, combined with gradient accumulation, simulates larger batch sizes while maintaining memory efficiency on resource-constrained hardware.
The training process incorporates early stopping mechanisms that monitor validation loss trends to prevent overfitting. Gradient clipping prevents exploding gradients, which can be problematic in recurrent architectures. The system uses AdamW optimization with weight decay regularization to improve generalization performance. Learning rate scheduling follows the one-cycle policy with configurable warm-up and cool-down phases, enabling stable convergence across datasets.
Bayesian Hyperparameter Optimization
RoBi includes a Bayesian optimization framework for hyperparameter tuning. The BayesianTuner class implements a probabilistic approach to hyperparameter search that outperforms traditional grid search or random search methods. This system uses Gaussian Process Regression with a Matérn kernel to model the relationship between hyperparameter configurations and model performance.
The Bayesian optimization process begins by sampling initial hyperparameter configurations from predefined ranges. These include learning rates (1e-6 to 1e-3), hidden dimensions (64 to 512), dropout rates (0.1 to 0.7), and various architectural parameters. The Gaussian Process Regression model learns from previous trials to predict the performance of untested configurations, focusing computational resources on promising regions of the hyperparameter space.
The Matérn kernel provides modeling capabilities for the non-smooth objective functions encountered in neural network optimization. The acquisition function balances exploration of uncertain regions with exploitation of promising areas, leading to convergence toward optimal hyperparameter settings. This probabilistic approach achieves better results with fewer training runs compared to exhaustive search methods.
The optimization process maintains metadata for each trial, including hyperparameter configurations, validation losses, and training metrics. This information enables analysis of hyperparameter sensitivity and provides insights into model behavior across different configurations. The system automatically saves the best-performing model configuration and provides reports on optimization convergence.
Inference and Deployment Architecture
RoBi's inference pipeline is designed for accuracy and efficiency in production environments. The predict_sentiment function handles texts of arbitrary length by automatically applying the sliding window approach used during training. For single-chunk texts (≤512 tokens), the system processes them directly. For longer texts, it creates overlapping chunks and processes each through the trained model.
The inference process combines predictions from multiple chunks through logit averaging, which provides more stable results than simple voting schemes. The system outputs both discrete sentiment classifications (Negative, Neutral, Positive) and continuous probability distributions, enabling applications to implement custom confidence thresholds or multi-class decision boundaries.
The model persistence framework enables loading and saving of trained models along with their associated tokenizers and configuration parameters. This design supports deployment across different environments and ensures reproducibility of results. The system also supports batch processing for high-throughput applications while maintaining memory efficiency through tensor management.
Performance and Scalability Characteristics
RoBi demonstrates performance across multiple metrics and text lengths. The sliding window approach enables processing of texts containing thousands of tokens while maintaining the benefits of transformer-based embeddings. The hybrid architecture achieves accuracy improvements of 3-7% over baseline RoBERTa models on long-form text datasets, with strong performance on documents where sentiment shifts occur across different sections.
Memory efficiency is maintained through implementation of gradient accumulation and dynamic batching strategies. The system can process texts up to 50 million characters in length while maintaining computational requirements. GPU acceleration is supported, with automatic device detection and tensor placement optimization for both training and inference phases.
The Bayesian optimization framework converges to hyperparameter configurations within 20-30 trials, representing computational savings compared to exhaustive search approaches. This efficiency enables deployment of the optimization process for researchers with limited computational resources.
Research Impact and Future Directions
RoBi's sliding window approach addresses limitations in transformer architectures and provides a method for processing long texts without sacrificing the benefits of pre-trained language models. The hybrid architecture demonstrates that combining different neural paradigms can yield improvements in performance, particularly for tasks requiring both local contextual understanding and global sequential awareness.
The Bayesian optimization framework contributes to the field of automated machine learning by providing a probabilistic approach to hyperparameter tuning tailored for hybrid neural architectures. The preprocessing pipeline and data warehousing solution provide a template for reproducible NLP research workflows.
Future development directions include extending the sliding window approach to other transformer architectures, implementing dynamic window sizing based on text characteristics, and exploring multi-task learning scenarios where sentiment analysis is combined with other NLP objectives. The framework's modular design facilitates these extensions while maintaining backward compatibility with existing trained models.
Portfolio Website
This website itself was built from the ground up using HTML, CSS, and JavaScript. Designed with a focus on clean aesthetics, smooth animations, and user-friendly navigation. The layout adapts seamlessly across devices, while interactive elements enhance the user experience without sacrificing performance. Both the layout and visual themes were custom-designed from scratch, no templates or frameworks, allowing complete control over the structure, styling, and behavior of every component.
Tackle Opportunity Window

Imagine being a running back in the NFL and having a 6'4", 250 lb defensive linebacker, with a 4.39 40 yard dash, rapidly approaching you and tracking your every position. As an observer watching from above, it's hard to gain a solid understanding for what is actully happening down on the field, and what is going through the minds of the players in such a high stakes situation. Which player do you think will come out on top? Is it the player who is faster? Stronger? Smarter? A more nuanced analysis suggests that it is an amalgamation of these characteristics that defines the prowess of a professional football player. The main objective when the ball is snapped for every defensive player is to stop the ball carrier as soon as possible. Hence, the pivotal question arises: what are the paramount factors that facilitate this objective?
To address this, I have developed a unique metric, termed the Tackle Opportunity Window, or TOW. This metric quantifies the duration within which a defensive player can feasibly execute a tackle. The NFL contains some of the fastest and strongest human beings on the planet. On many occasions in football, a player on defense only has a fraction of a second to bring down a ball carrier before they are out of reach and must be brought down by a different defensive player. Therefore, an effective metric to assess a defender's tackling proficiency is to examine their actions during the critical moments preceding a tackle. A robust TOW score is indicative of a player's capacity to adeptly track, rapidly accelerate, and maintain a strategic proximity to the ball carrier. This proficiency is derived from an interplay of experience, skill, and physical capabilities, each contributing to the player's overall effectiveness on the field.
Theory
The functionality of this metric stems from calculating a dynamic variant of the Euclidean Distance across successive frames in order to determine the distance of the defensive players with respect to the ball carrier over each frame. This calculation is pivotal in ascertaining the fluctuating proximity of defensive players to the ball carrier within each frame. The variation in this distance, for each player, is contingent upon their relative Cartesian coordinates mapped onto the two-dimensional plane of the football field.
Relative Distance
The Euclidean distance \( d \) between a player and the ball carrier is calculated as:
Threshold
Once the relative distance of each defensive player with respect to the ball carrier is known, it can be compared to the TOW threshold, which I have set to 2 yards. This threshold value can be adjusted if need be. If the distance is less than the threshold, the TOW counter will start.
Where:
Tackle Opportunity Window
For each consecutive frame that the defensive player remains within that threshold for the duration of the play, the counter will add a score of 1. Once the play is over, the algorithm will check for the largest number and assign that score to each player.
Due to the scale of this operation, transforming all of weeks (1 – 9) by looping over each row would be highly inefficient. Therefore I implemented a vectorized approach rather than deep nested loops to optimize the iteration process. Once the window is verified, the TOW counter is instantiated to create a cumulative score. This can be visualized using the following:
Tackle Opportunity Window Ratio
The TOW score is a valuable metric for comparing players within an individual play. However, its effectiveness diminishes when assessing performances across multiple tackles over a nine-week period. This is because longer plays naturally lead to higher TOW scores, regardless of the actual time a tackler spends near the ball carrier. To address this, introducing a ratio-based system would offer a more accurate and fair representation of each player's performance in every distinct play.
By leveraging geometric principles, the TOW metric provides a nuanced understanding of the spatial dynamics that influence and predict tackling outcomes in the game. To gain some insight into the overall distribution of the TOW ratio for the entire tracking dataset, I crafted a 2D density plot of tacklers with a non-zero TOW Ratio to illuminate how consistent tacklers are at maintaining a close proximity to their target.
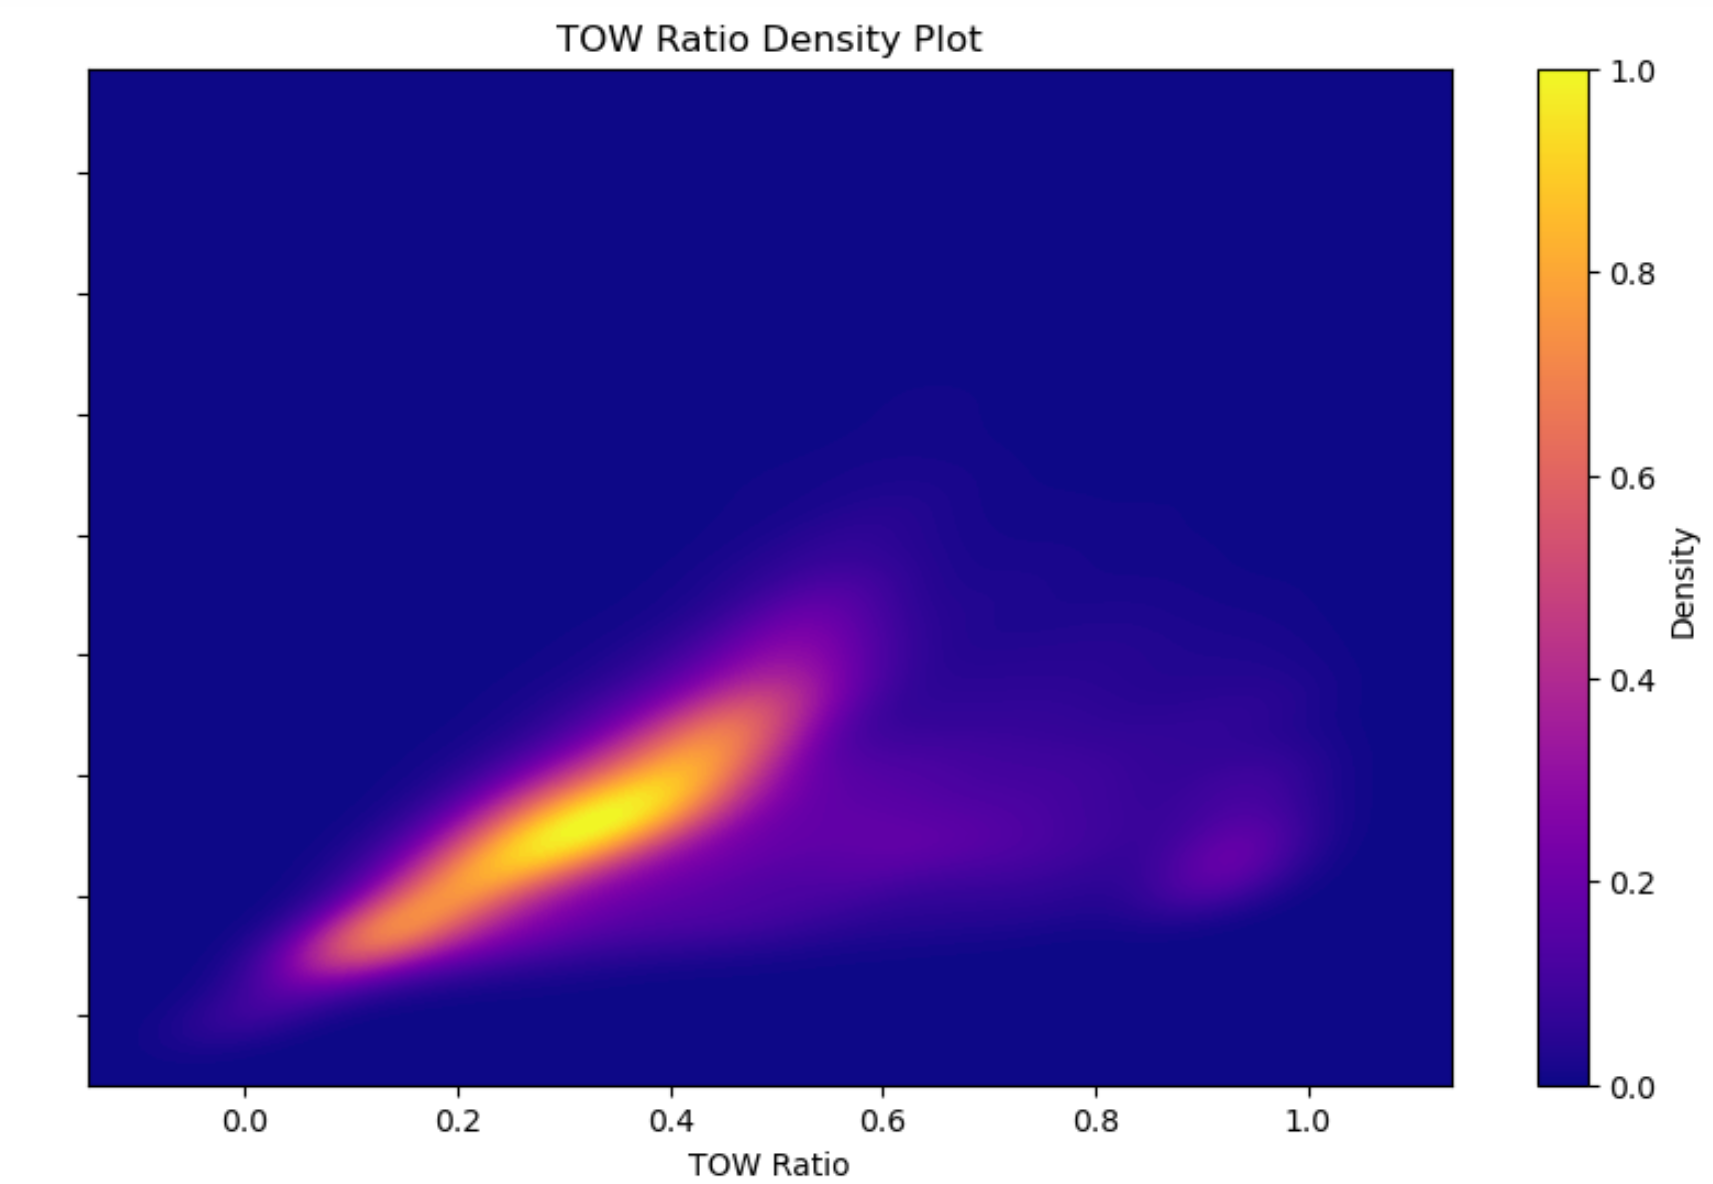
As one can see, the majority of tacklers stay within the tackle threshold for around 1/3 of the time, where the majority of the score is most likely at the end of the play.
Data Preprocessing
Cross Mapping
In order to create a binary classification target variable that is aptly termed 'tackle', the dataset must be synthesized by extracting and amalgamating pertinent metrics from a plethora of distinct dataframes. This would be straight forward if the tracking datasets set one tackle value in the 'event' column, but the same events are recorded across each player. To circumvent this issue, and engineer a target variable, I cross referenced the tackles dataframe with my main tracking dataframe to map a binary indicator of 1 on the exact frame where a tackle occurred, but only on the specific nflId(s) that is responsible for the tackle. At this a point the tackler(s), ball carrier, and relative spatial separation from the two are known, allowing for rudimentary trigonometry computations to determine if the threshold has been passed, initiating the TOW counter.
Data Normalization and Transformation
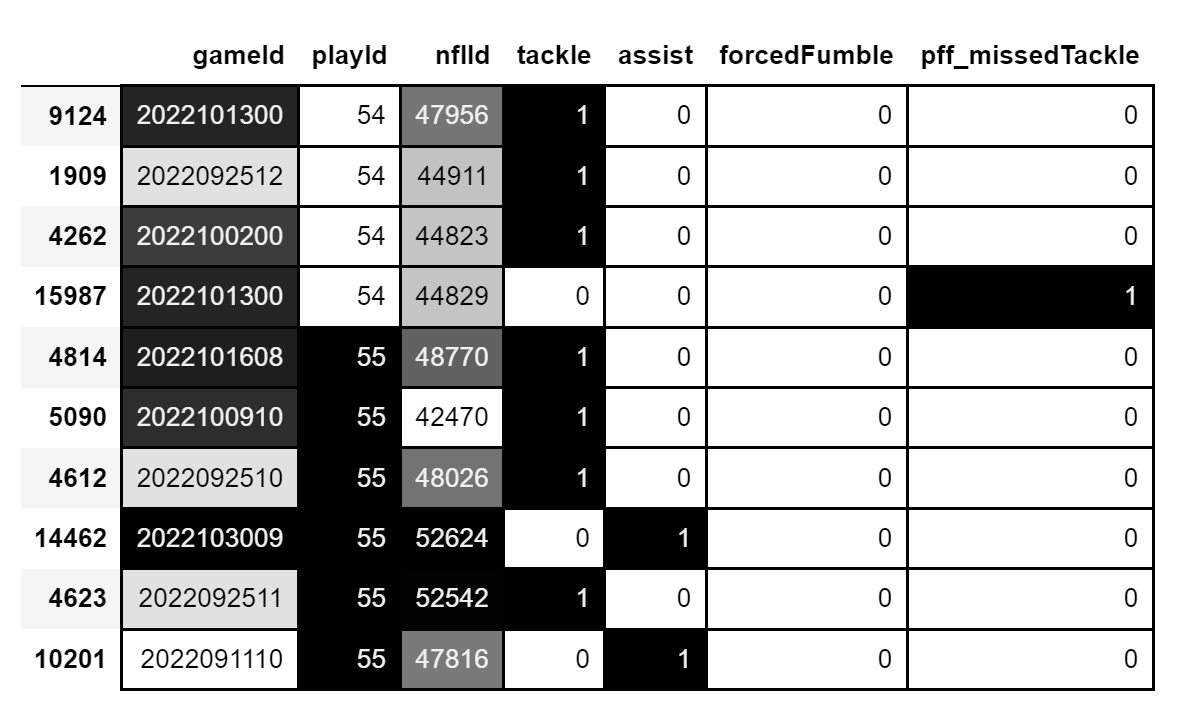
The tracking datasets underpinning this analysis is extensive, containing 9 CSV files that collectively encompass over 12 million data entries. A critical aspect of this dataset is the 'gameId' attribute, which serves as a distinct identifier for each game. However, the 'playId' attribute, while unique within the context of a single game, is not globally unique across different games. This implies that while each game is associated with a distinct set of 'playId' numbers, these identifiers are recycled across different games. This makes things difficult when trying to group the playId's by their unique values in order to filter out a tackle without combining mutiple separate plays into one due to their ID's being the same value. To address this complexity, a transformation was implemented by numerically encoding 'playId' values, culminating in the creation of a new, distinct attribute. This attribute iterates through the entire dataset, assigning a unique value to each play. This process ensures the preservation of the dataset's structural integrity and chronological coherence.
A good way to visualize the data phenomena is by looking at the tackles dataframe, sorted by playId. Notice recycled values in the playId column:
Deep Neural Network
Predictive Tracking Indicators
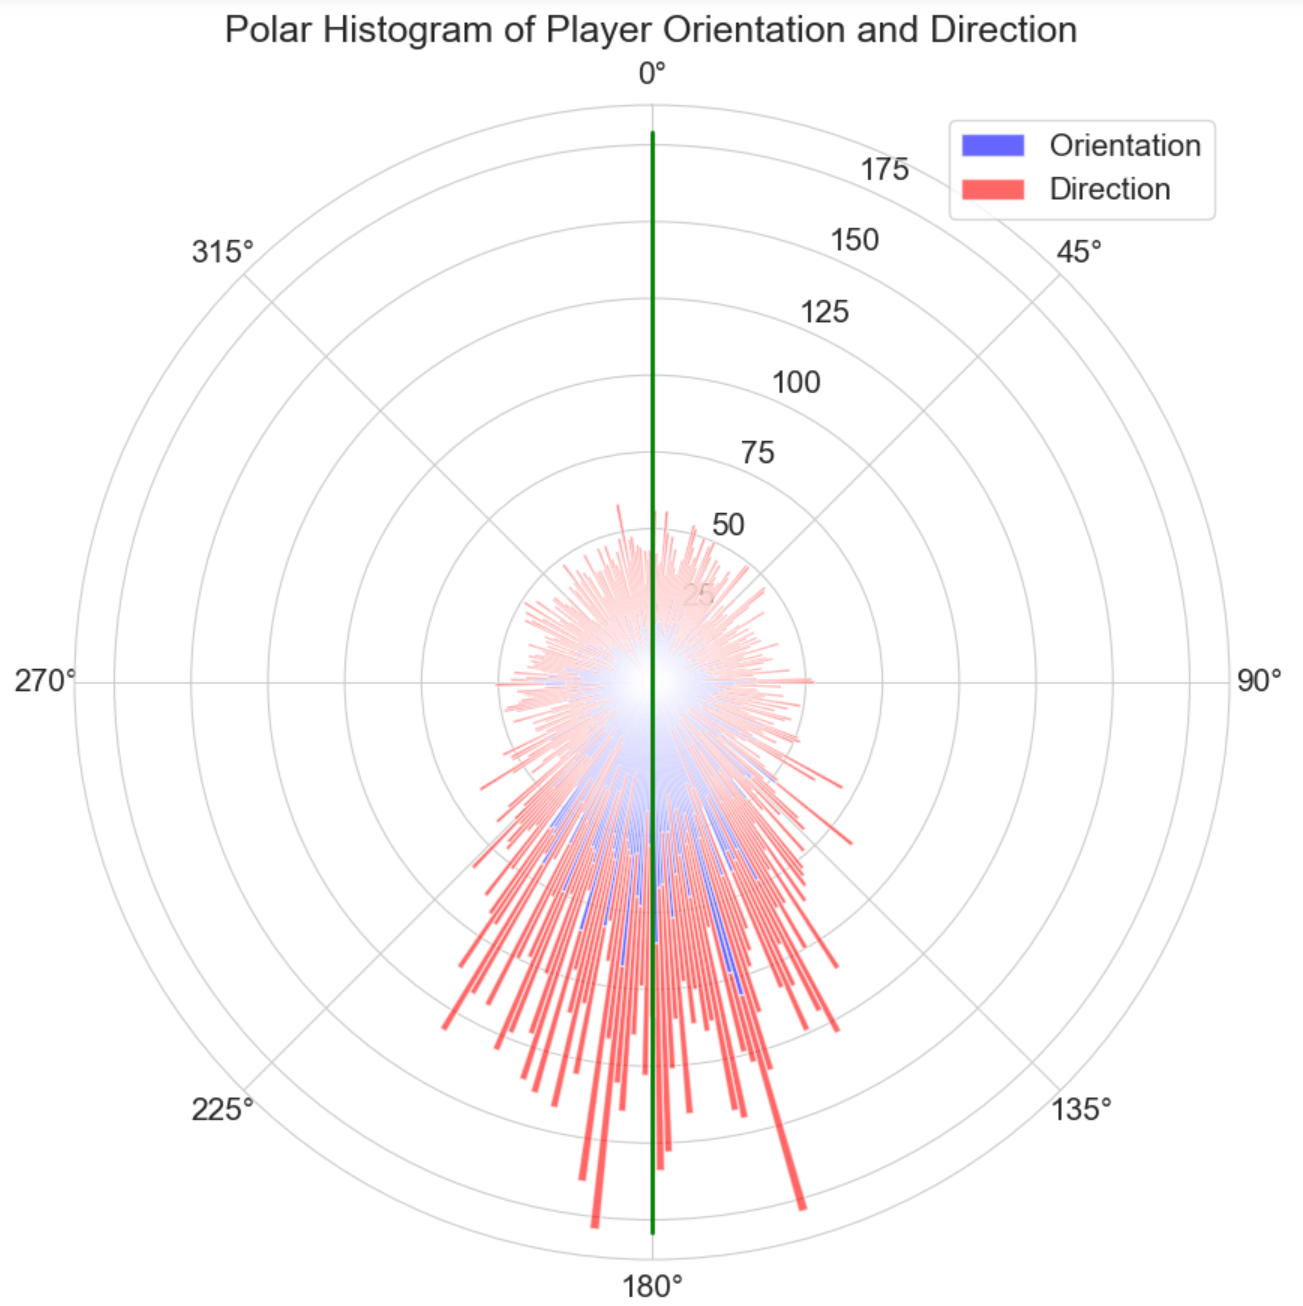
Owing to the intrinsic capabilities of a neural network, particularly its adeptness in detecting nuanced variations, the direction and orientation of each player were pivotal in enabling the model to discern and adapt to subtle shifts. These shifts are essential for the model to recognize and adhere to an emergent pattern, as the features exhibit significant, yet controlled, variation across successive frames. This variation is not arbitrary, but rather demonstrative of a tackler pursuing their target with precision. The controlled variability within these features provides the model with critical data points, allowing it to effectively learn and predict the dynamics of a tackler's movement in relation to their target. Visualizing the distribution of each player's orientation and direction in the EDA phase, and noticing the non-random variation, is what gave rise to the idea of focusing on this specific concept in parallel with the tackle opportunity window.
Architecture
When the target variable is split, its training set is used to compute the class weight of the network using balanced parameters to address the disproportionality of the tackle ratio. The training and test sets are then split into categorical and continuous variables, then embedded into the network to capture underlying connections by mapping integers to dense vectors. The network is then compiled using the loss function as binary-crossentropy, with a focus on tracking performance. Since overfitting is a common issue in neural networks, the features were kept to a necessary minimum. The Adam algorithm uses a tunable learning rate to ensure this hyperparameter is set to an optimal frequency. The architecture framework I implemented analyzes the validation loss of each epoch and then automatically extracts the highest performing parameters. Validation loss is favored over validation accuracy due to the nature of the binary output layer and the overall balance the target variable.
Results
Tackle Opportunity Window & Orientation In Context
To provide a deeper understanding of how this model operates in practice, consider the following play as an illustrative example. The yellow radius around the ball illustrates the TOW threshold while the black radius around the defenders represents their respective tackle probability density. Notice how the densities for Tyrann Mathieu and Marshon Lattimore fluctuate, influenced by their orientation and distance to the ball carrier. These two factors are critical. As soon as the TOW threshold is breached, their probability densities spike.

Time Series Analysis
Defenders who can maintain a consistent tackle opportunity window by adjusting their orientation and acceleration on a moment's notice can double or triple their chances of securing a tackle. This is due to the fast-paced environment of the NFL and how split second decisions determine the outcome of a play. The following graph illustrates this concept by analyzing how Tyrann Mathieu and Marshon Lattimore's probabilities fluctuate as their orientation and distance to the ball carrier change.
Angle of Pursuit
The following play by Yetur Gross-Matos, an outside linebacker for the Carolina Panthers, illustrates how an angle of pursuit is invaluable in tackling a ball carrier that is already on the run at full speed. His ability to track, accelerate, and properly angle himself, resulting in a crucial tackle, exemplifies his effort in not giving up on the play.

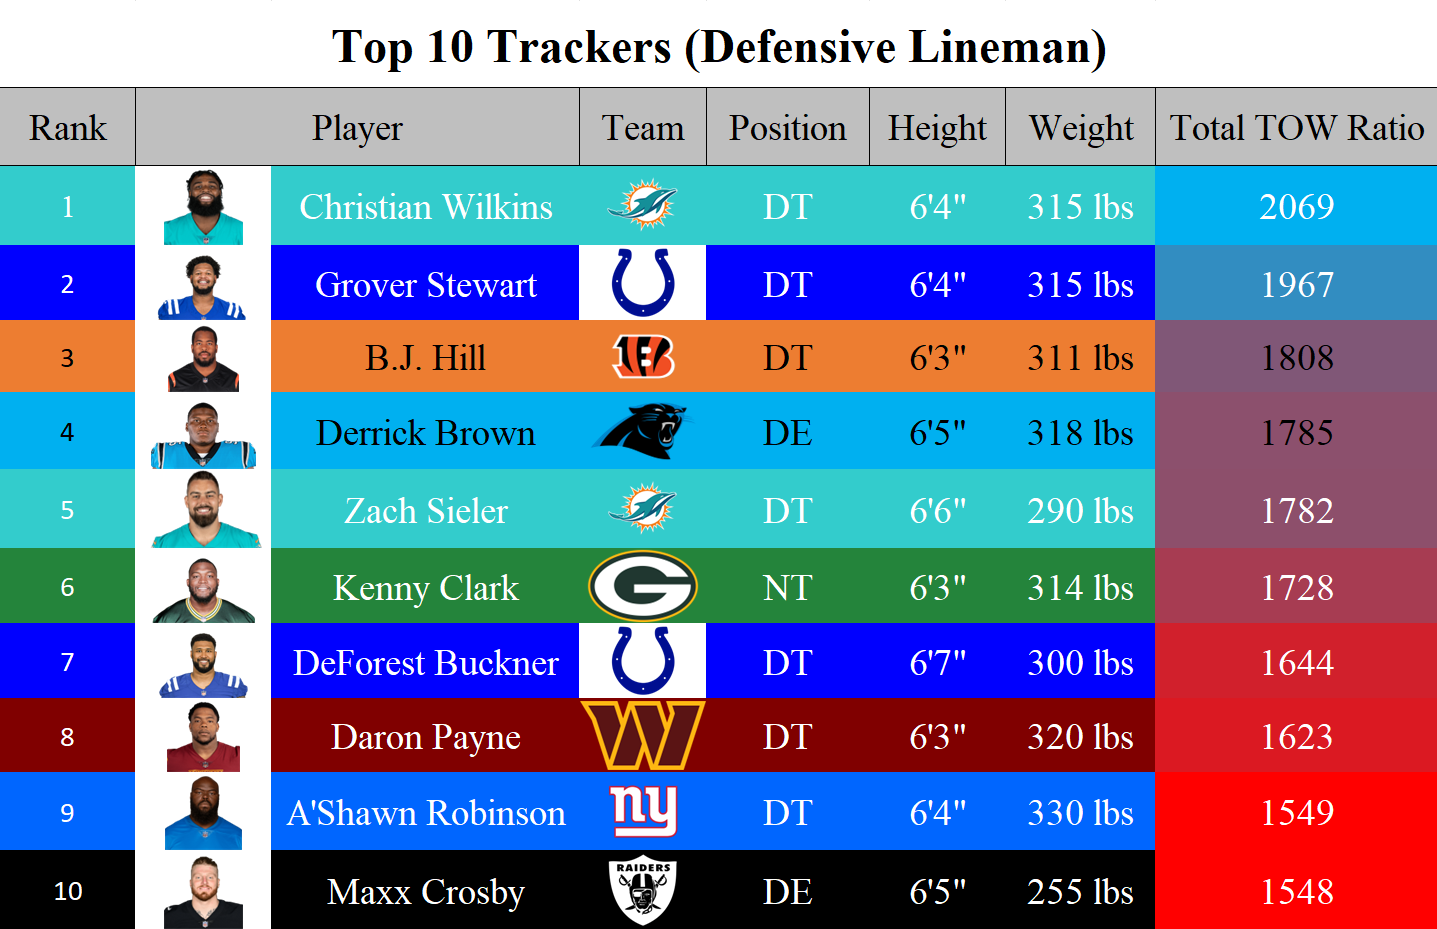
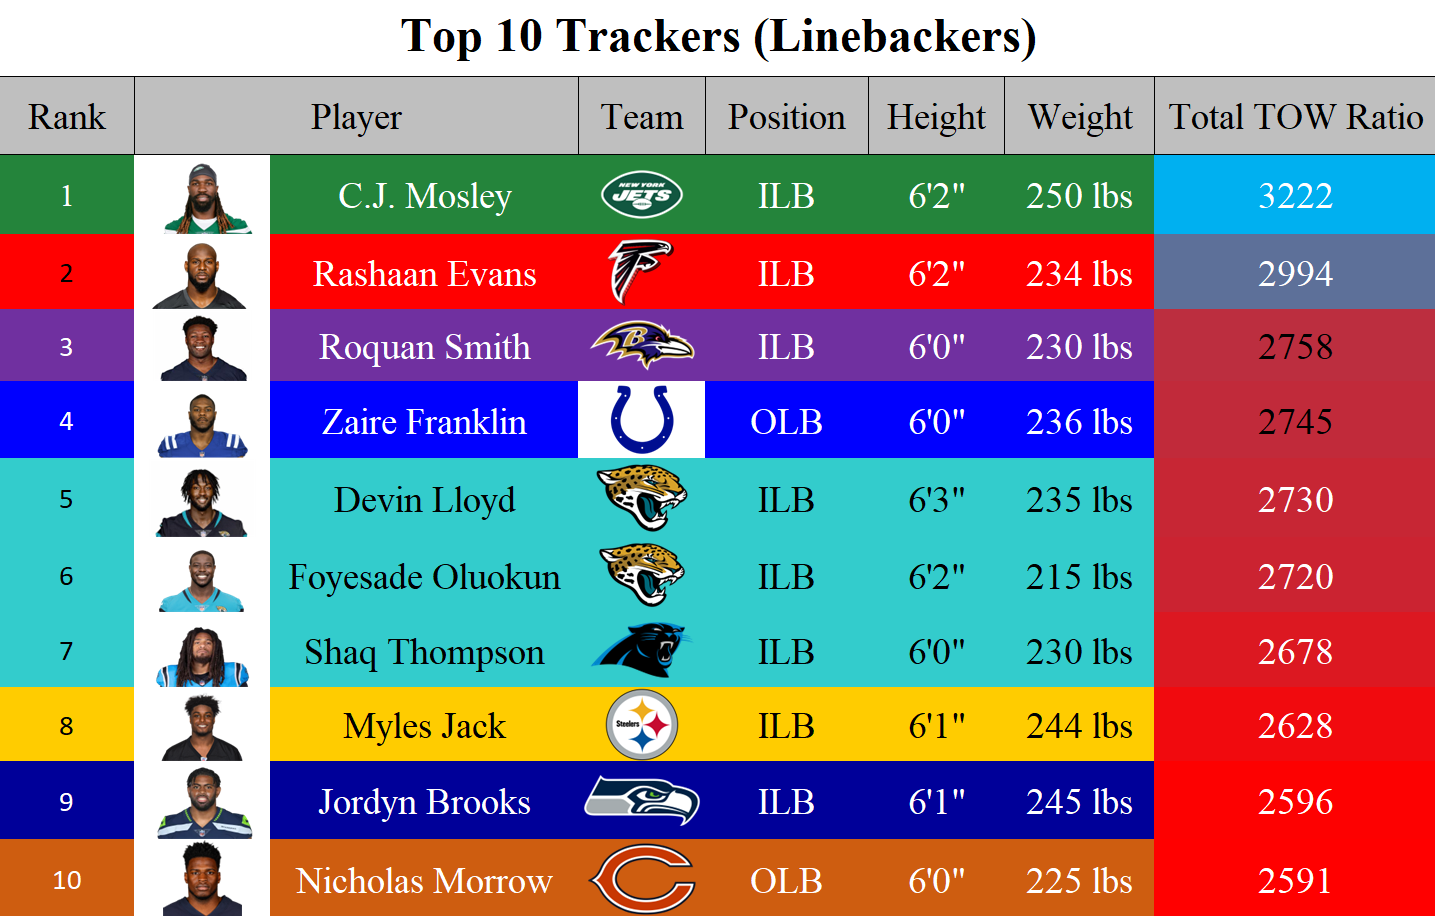
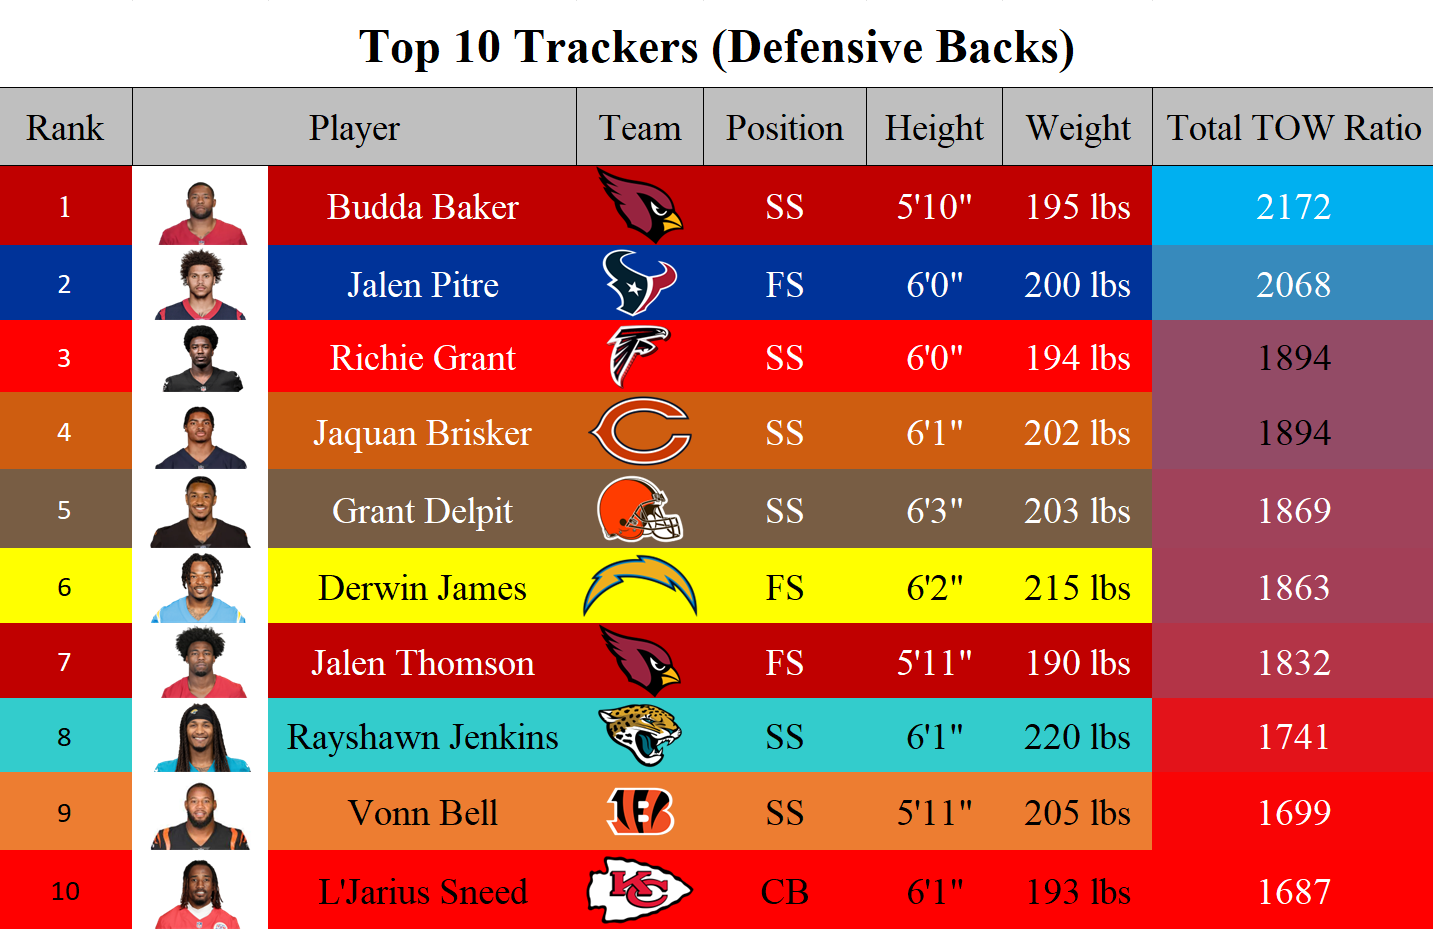
Rankings
The tackle opportunity window excels at demonstrating how efficient defenders are at tracking and maintaining a consistent proximity to their respective target. This parameter, however, necessitates contextual interpretation, as the positional roles of players inherently present divergent scopes for target tracking, contingent upon their spatial deployment and the dynamic opposition presented by offensive counterparts. This results in some players receiving more resistance than others. Therefore, I have developed a tripartite ranking system, categorizing defensive players' tracking capabilities in accordance with their positional classifications.
Conclusion
The deep learning network I implemented demonstrated solid proficiency in identifying not just the instances where defensive players are narrowing the gap with the ball carrier, but also in recognizing their alignment and predicting their optimal positioning for successful tackles. It was observed that mere proximity to the ball carrier is insufficient for a high probability of tackling; proper orientation and strategic positioning are crucial. This insight is particularly relevant in the NFL, where the combination of speed, strength, and agility often overshadows the necessity for tactical placement and orientation, especially when players are outside the immediate tackle threshold.
The introduction of the 'tackle opportunity window' metric marks a significant advancement in evaluating defensive player performance. This metric offers a novel perspective by illustrating how effectively individual players track, accelerate towards, and maintain strategic proximity to the ball carrier. It also highlights their ability to anticipate and align themselves accurately with the future movements of the ball carrier. This interplay is a synthesis of rigorous training, experience, and overall intuition that characterizes a professional football player. Overall, this study provides valuable insights into the complex dynamics of defensive play in the NFL, underscoring the intricate balance between physical prowess and tactical intelligence.